
Recently, Greg Laughlin, the founder of a new statistical software called Statwing, let me try his product for free. I happen to like free things very much (the college student is strong within me) so I gave it a try.
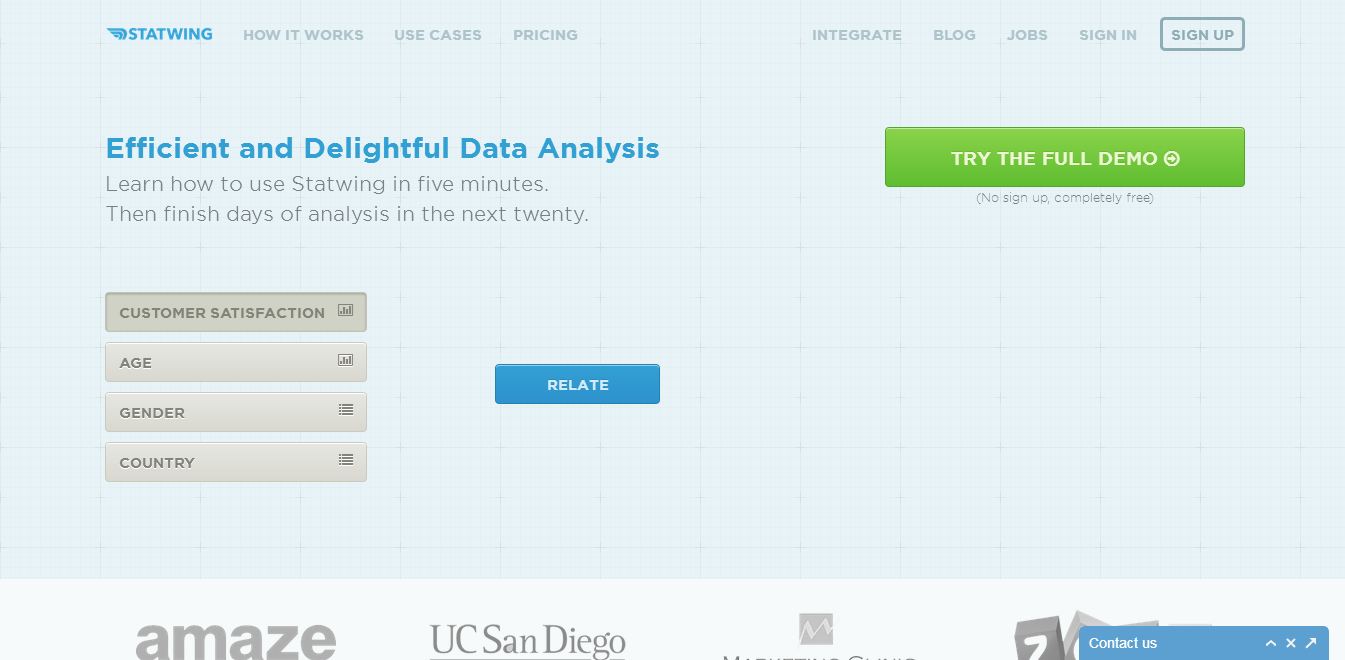
I mostly like how easy it is to use: For instance, to relate two attributes like Age and Income, you click Age, click Income, and click Relate.
So what can Statwing do?
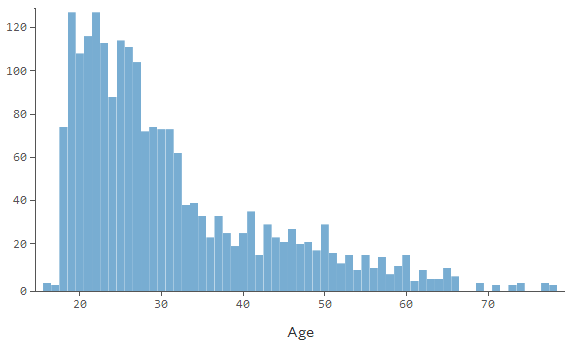
- Summarize an attribute (like “age”): totals, averages, standard deviation, confidence intervals, percentiles, visual graphs like the one below
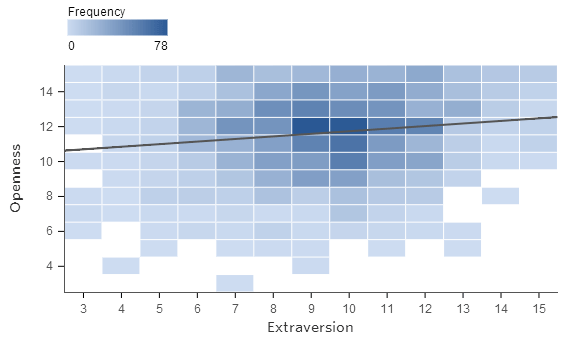
- Relate two columns together (“Openness” vs “Extraversion”)

- Plots the two attributes against eachother to see how they relate. It will include the formula of the regression line and the R-squared value.
- Sometimes a chi-square-style table is more appropriate. The software determines how best to represent the data.
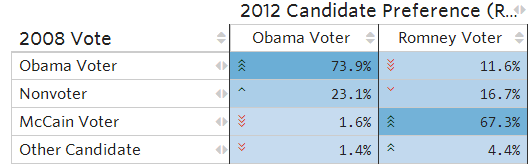
- Tests the null hypothesis that the attributes are independent, by a T-test, F-test (ANOVA) or chi-square test. Statwing determines which one is appropriate.
- Repeat the above for a ranked correlation.


For now, you can’t forecast a time series or represent data on maps. But Greg told me that the team is adding new features as I type this.
If you’d like to try the software yourself, click here. They’ve got three sample datasets to play with:
- Titanic passengers information
- The results of a psychological survey
- A list of congressman, their voting record and donations.

The software looks interesting! Will be sure to check out data on the Titanic passengers 🙂
Glad you thought so too, Katarina. If you like CoolStatsBlog, spread the word 🙂
Great to see your blog getting recognized. I checked out the software, like you said it’s pretty easy to use with an excellent website layout. Keep posting more articles and I hope this recognition is just a start for many more to come.
Thanks, Khuddoos! Yeah, I love their interface, too. You can accelerate the recognition process by telling friends who might enjoy this blog.