
What is a chi-square test: A chi square tests the relationship between two attributes. Suppose we suspect that rural Americans tended to vote Romney, and urban Americans tended to vote Obama. In this case, we suspect a relationship between where you live and whom you vote for.
The full name for this test is Pearson’s Chi-Square Test for Independence, named after Carl Pearson, the founder of modern Statistics.
How to do it:
We will use a fictitious poll conducted of 100 people. Each person was asked where they live and whom they voted for.
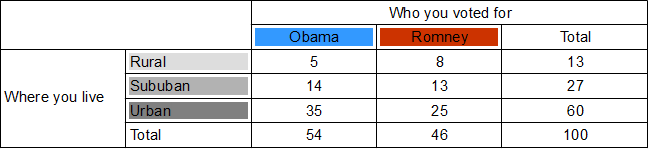
- Draw a chi-square table.
.
Each row will be whom you voted for, giving us two columns for Obama and Romney. Each row will be where you live, giving us three rows – rural, suburban and urban.
- Calculate totals for each row and column.
.
The purpose of the first column total is to find out how many votes Obama got from all areas. Similarly, the purpose of the first row total is to find out how rural votes were cast for either candidate.
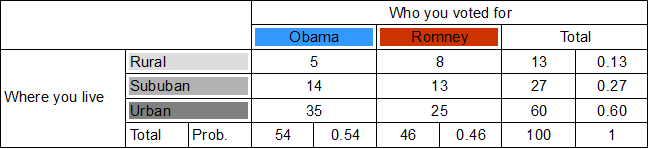
- Calculate probabilities for each row and column.
.
These will be the individual probabilities of voting Obama, voting Romney, living in the country, etc… For example, the Obama column total tells us that 54 out of 100 people polled voted Obama, so probability of voting Obama is 0.54.

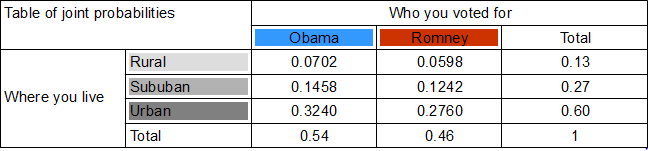
- Calculate the joint probabilities of belonging to each category.
.
For example, probability of being rural and an Obama voter is found by multiplying the probability of voting Obama (0.54) with the probability of living in the country (0.13). So, 0.54 x 0.13 = A person has a 0.0702 chance of being a rural Obama voter.
.
In doing so, we assume that where you live and whom you voted for are independent. This assumption, called the null hypothesis, may well be wrong , and we will test it later by testing the joint probabilities it yielded.

- Based on these joint probabilities, how many people do we expect to belong to each category?
.
We multiply the joint probability for each category by 100, the number of people.

- These expected numbers are based on the assumption (hypothesis) that whom you voted for and where you live are independent. We can test this hypothesis by holding these expected numbers against the actual numbers we have.
.
First, we need our chi-square value.
.
.
Basically, the equation asks that, for each category, you find the discrepancy between the observed numberand expected number
, square it, and then divide it by the expected number
.
I got 0.769 as my chi-square value.
. - Look at a chi-square table.
.
Note that out degrees of freedom in a chi square test is. In our case, with 3 rows and 2 columns, we get 2 degrees of freedom.
.
For a 0.05 level of significance and 2 degrees of freedom, we get a threshold (minimum) chi-square value of 5.991. Since our chi-square value 0.769 is smaller than the minimum, we cannot reject the null hypothesis that where you live and who you voted for are independent.


That is the end of the chi square test for independence.

Seems like your first ‘real’ statistical post. Though the content is somewhat heavy, the terms have been explained really well. Step by step methods make the problem easily solvable. Good work!
If you scroll through the page, you’ll find plenty of articles exploring the theoretical applications of AIC, autocorrelation, etc… Some of the early ones might even count as “deep statistics”.
Thanks for reading. I hope this page comes in handy to you some day.
it is useful thank you very much
Hi Mr. Abbas : this is my first work with statistics and im confused with chi – if you can help me == Ahmed
You showed the steps to calculate the chi-square very well. However, your final computation of the chi-square was wrong. The figure is supposed to be 1.767322258 and not 0.769. Thankyou.