
 |
 |
|
Histogram: LM estimates of Intercepts |
Histogram: LM estimates of Gradient |
 |
 |
|
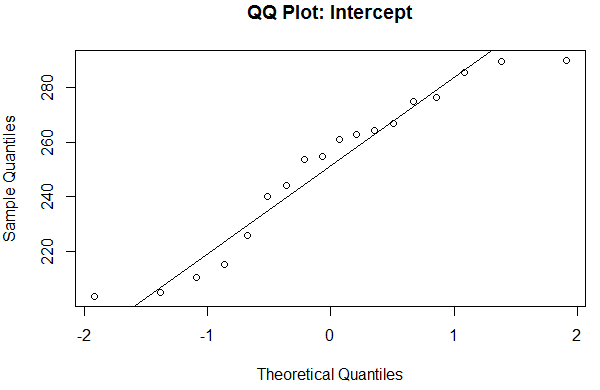
QQ Plot: LM estimates of Intercepts |
QQ Plot: LM estimates of Gradient |
Figure 1: Gradient appears to follow a normal distribution more than intercept .
When do we use a parametric model, and when do we use a non-parametric one? In the above example, “Intercept” is one random variable, and “Gradient” is another. I will show you why “Intercept” is better modeled by a non-parametric model, and “Gradient” is better modeled by a parametric one.
In Figure 1, histograms and QQ plots of “Intercept” and “Gradient” show that the latter appears to follow a normal distribution whereas the former does not. As such, a parametric (normal) distribution would not be appropriate for modelling “Intercept”. This leads us to believe that a non-parametric distribution is a better method for estimating “Intercept”.
However, a parametric (normal) distribution might be appropriate for modelling “Gradient”, which appears to follow a normal distribution, according to both its histogram and QQ plot.
Abbas Keshvani

Thank you a bunch for sharing this with all folks you actually know what you are speaking about!
Bookmarked. Please also talk over with my site =). We will have a hyperlink change arrangement
among us
You actually make it seem so easy with your presentation but I find this topic to be actually something which I think I would never understand.
It seems too complex and extremely broad for me.
I’m looking forward for your next post, I will try to get the hang of it!
Thanks, there will be another post soon!
WordPress domain and hosting
Woah! I’m really digging the template/theme of this blog.
It’s simple, yet effective. A lot of times it’s very difficult to get that
“perfect balance” between user friendliness and visual appeal.
I must say you’ve done a excellent job with this. Also, the blog loads extremely quick for me on Firefox.
Outstanding Blog!
Piekielnie atrakcyjny wpis, zalecam ludziom