
 |
 |
|
Histogram: LM estimates of Intercepts |
Histogram: LM estimates of Gradient |
 |
 |
|
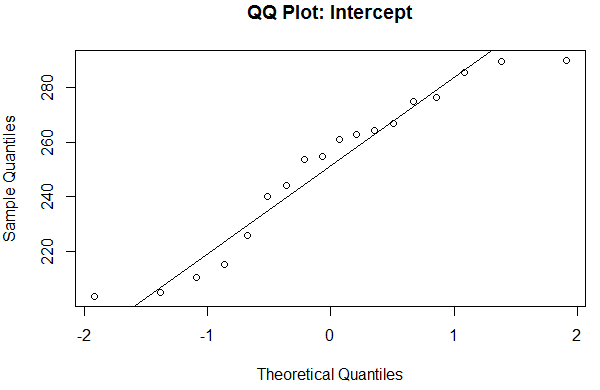
QQ Plot: LM estimates of Intercepts |
QQ Plot: LM estimates of Gradient |
Figure 1: Gradient appears to follow a normal distribution more than intercept .
When do we use a parametric model, and when do we use a non-parametric one? In the above example, “Intercept” is one random variable, and “Gradient” is another. I will show you why “Intercept” is better modeled by a non-parametric model, and “Gradient” is better modeled by a parametric one.
In Figure 1, histograms and QQ plots of “Intercept” and “Gradient” show that the latter appears to follow a normal distribution whereas the former does not. As such, a parametric (normal) distribution would not be appropriate for modelling “Intercept”. This leads us to believe that a non-parametric distribution is a better method for estimating “Intercept”.
However, a parametric (normal) distribution might be appropriate for modelling “Gradient”, which appears to follow a normal distribution, according to both its histogram and QQ plot.
Abbas Keshvani
