On absentee/mail-in voting

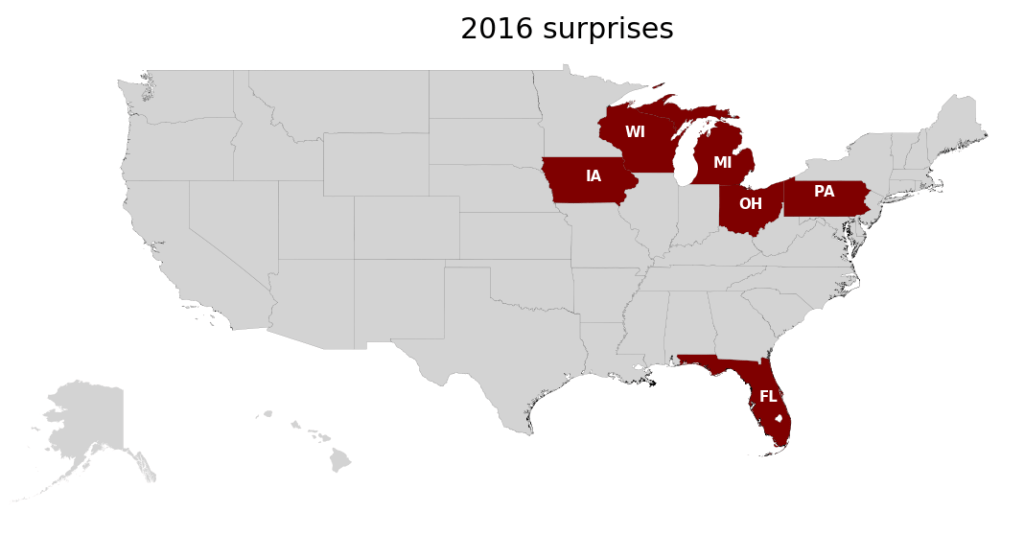
In my last post I forecasted a Trump victory based on him retaining key swing states like Florida, Ohio, Pennsylvania, and Wisconsin (although not Michigan).

But reports of a surge in absentee/mail-in voting signups by Democrats in some of these states raise questions about whether Trump will really be able to hold on to them.

Basics

  • Mail-in voting is the same as absentee voting. Different states use different terms, but both refer to the same thing: voting using the postal service.
  • Universal mail-in voting is a sub-category of absentee/mail-in voting, where the state will send every voter a ballot in the mail, whether or not they request one. The voter then has a choice to vote by mail, vote in person, or not vote at all.
  • Colorado, Hawaii, Oregon, Utah, Washington, California, Nevada, Vermont, and New Jersey have universal mail-in voting. None of these are swing states.
  • Trump has criticized universal mail-in voting: “Absentee ballots, by the way, are fine… But the universal mail-ins that are just sent all over the place, where people can grab them and grab stacks of them, and sign them and do whatever you want, that’s the thing we’re against.”

Crunching the numbers

Let’s take a look at the absentee/mail-in data for Florida, Pennsylvania, Wisconsin, and North Carolina, where I noted that the outcome was relatively uncertain.

One of the headline-grabbing figures it that around 650,000 more Democrats have signed up for absentee ballots than Republicans have, indicating that there will be a surge in turnout among Biden voters in November.

But it is important to consider the possible sampling bias at play here:

  • A Monmouth survey (6-Aug to 10-Aug) reported that 72% of Democrats but only 22% of Republicans were likely to vote by mail
  • A Pew survey (27-Jul to 2-Aug) showed 58% of Biden supporters would prefer to vote by mail, but only 17% of Trump supporters felt the same way
  • A TargetSmart survey (21-May to 27-May) showed that 52% of Democrats and 33% of Republicans intended to vote by mail

One of the main reasons for this divide could be that Trump’s rhetoric against mail-in voting has turned usage of the facility into a partisan issue. The bottom line is that using absentee signups to estimate voter turnout could be overestimating the Democrat edge.

Given that Democrats tend to favor absentee voting, for a state like Florida where Democrats and Republicans are roughly matched in numbers, we should expect there to be more Democrats signing up for absentee ballots in that state. In fact I estimate that, ceteris paribus, Democrats should have an edge in absentee ballot signups by around 819,000.

I use numbers of people that voted for either party in 2016 and the respective propensity for voters for each party to sign up for an absentee ballot (conservative 52-33 propensities) to estimate the below expected edges for the Dems:

Numbers for FL and NC are from state governments; using estimates by polling firm TargetSmart for PA and WI

As you can see, although Democrat absentee signups are impressive, for each state they are less than what they should be given the propensity of Democrats to vote by mail anyway. This would indicate that enthusiasm among Democratic voters is weak, a fact I pointed to in my analysis of polling and primary data.

Putting it altogether…

Data for FL and NC from state governments; data for PA and WI from pollster TargetSmart
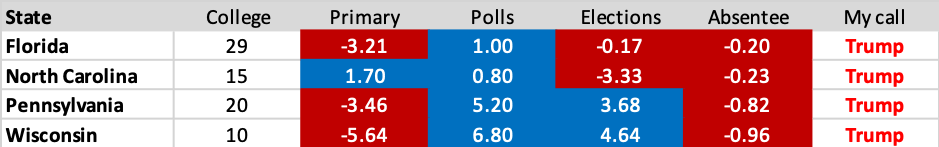
  • Florida: Polls are razor-thin, while primary and absentee data suggests lackluster engagement among Democrats.
  • North Carolina: polling and primary data is very close, while absentee signups for the Democrats are disappointing.
  • Pennsylvania and Wisconsin: polls show Biden with a decent lead, but less people voted in those states’ Democrat primaries this year than in 2016. In line with my conservative approach, I am giving these states to Trump.

Since my call remains a Trump win with just 289 electoral college votes (306 in 2016), the loss of just Florida to Biden, or any two smaller states from the above table would change the outcome of the election. So I will keep monitoring polling and absentee data (the above table has been updated for polling data) and revise my calls if required.

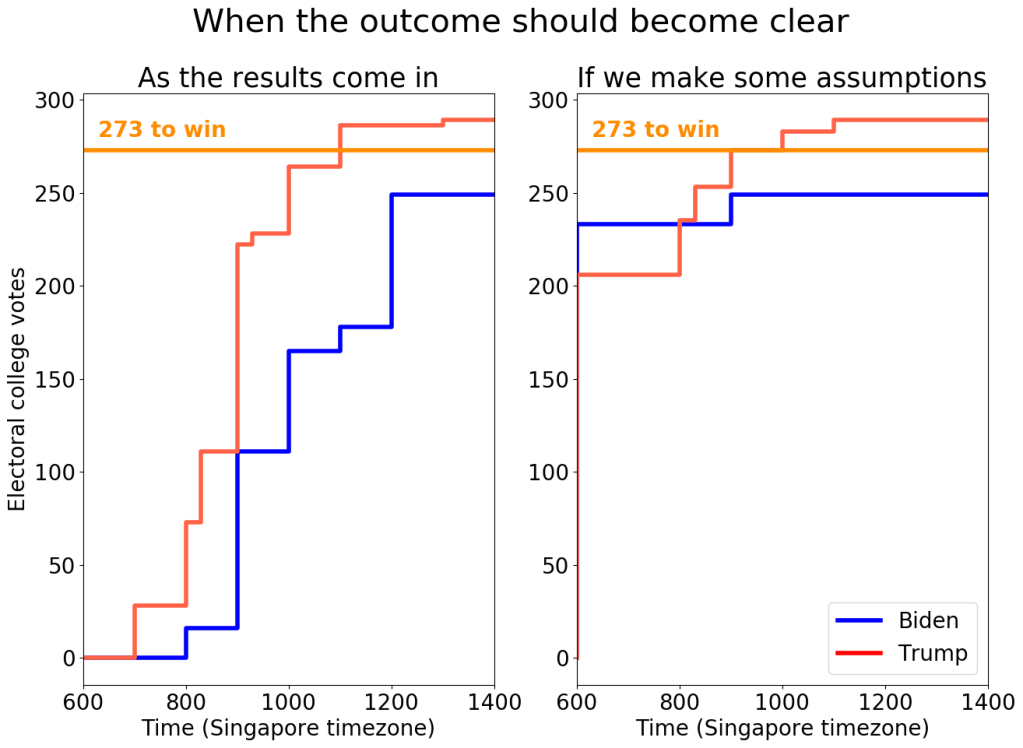
Timelines: It takes longer to count a mail ballot than a regular one because officials must open thick envelopes, inspect the ballots, and confirm voters’ identities. The large number of people opting for absentee voting may delay the timeline for knowing the outcome of the election. Also, given that Democrats are more likely to use absentee ballots, the initial results we get on polling day are likely to skew the initial outcome in favor of Trump. All of this means we could be in for an “election week” rather than election day, with controversy to follow if the final results differ from those on election day.

If you have questions or feedback, feel free to reach out to me: abbas [dot] keshvani [at] gmail.com.

Advertisement

The 2020 US Model

Click here to skip to results.

In the summer of 2016 I built a model that combined past election, polling, and primary data to accurately predict that Donald Trump would be elected the US president later that year. My model showed the GOP taking 300 electoral college votes (they ended up getting 306) and correctly predicted surprise outcomes in Florida, Iowa, Ohio, Michigan, and Wisconsin.

Surprise victories in FL, IA, PA, MI, OH, WI catapulted Trump into the White House

Primer on the system: The US presidential election comprises 51 separate elections – one per state. Each state is worth a certain number of electoral college votes (e.g. California has 55, Wyoming has 3). If a candidate wins a state by plurality, then they bag all the electoral college votes of that state (except Maine and Nebraska which allocate their votes by some degree of proportional representation). The winner of the election is the person to get 270 electoral college votes in total.

Not all states matter as much: California almost always votes Democrat and Alabama almost always votes Republican. But states like Florida and Ohio tend to swing around between the two parties, which is why they are called “swing states”. This means that the variation in results for different elections comes down to whom the people in swing states vote for. For example, Trump won in 2016 because of shock victories in the swing states of Florida, Iowa, Pennsylvania, Michigan, Ohio, Wisconsin.

Watch out for the swing states in white – they can vote either way

Methodology overview: As in previous years, the winner of the election will be decided by swing states like Florida, Pennsylvania, Michigan. If you find a way to reasonably forecast how these states will vote, then you have a decent election model. To do this, I will use primary and polling data.

Primaries: Using this data is a little more challenging this year because we don’t have “good quality” primary data. Although the GOP technically held primaries this year, using turnout at those primaries as a proxy for voter enthusiasm for the party is problematic, since Trump is running again anyway. So instead I am comparing 2020 Democrat primary turnout with 2016 Republican primary turnout adjusted for estimated changes in population in those 4 years.

Polls: After the twin shocks of Brexit and Trump in 2016, many people are rightly skeptical about relying on polling alone. In reality, in all the states where Trump won by surprise, Clinton was leading in the polls by only 3-4%. Many of these opinion polls sampled a few hundred participants, which means that the margin of error would have been around 4% or even more. I did not use polls in 2016 if they were not conclusive and I am doing the same this year.

Conservative approach: I am opting for a conservative approach, which means that in the event of a close call like Florida – thin margins on primary, polling, and election numbers – I assume that the state will remain with Trump this year. In Pennsylvania and Wisconsin, although the polling favors Biden, the Democrat primaries did not garner enough turnout in the primaries to assure me that enough people will turn out for Biden in November.

What’s the bottom line? With the polling information we currently have, I expect Trump to hold on to the White House with 289 electoral college votes (270 needed).

I predict Trump will keep all of his 2016 swings except Michigan
  • Georgia, Texas, Arizona have voted for the Republican candidate with comfortable margins in recent elections, so I am giving them to Trump. Iowa tends to swing around but Trump won that state by 10% in 2016 so I am giving it to him.
  • Florida and Ohio polls are too close for me to attach much significance to them right now. I would rather trust primary data, which shows similar levels of enthusiasm for the Democrats as in 2016 (FL) or reduced enthusiasm (OH). They also go to Trump.
  • Pennsylvania and Wisconsin polls show Biden with a decent lead, but less people voted in those states’ Democrat primaries this year than in 2016. I am giving them to Trump.
  • Michigan primaries indicated a surge in enthusiasm for Democrats and this is backed by the polls. The state only marginally supported Trump in 2016, so I am giving it to Biden.
  • North Carolina is too close to call. Trump won it by less than 4% in 2016 and the poll and primary data is very close. For now I am keeping it with Trump in line with my conservative approach, but even if Biden wins it, it alone would not change the outcome.
Breakdown of key state calls

Timeline of the results: Different states declare the winner at different times, with east coast states like New York typically reporting before west coast states like Washington state. This means that we can also predict when the outcome will become apparent.

If a state reported results at the moment polls closed, then a Trump victory would be confirmed at 11am SGT on 4-Nov (3am London, 4-Nov / 10pm New York, 3-Nov). In reality, you would have to wait around an hour for the results to start trickling in. We can go one step further and make assumption about how the safer states will vote. This way, we should know the outcome even earlier from around 10am Singapore (4 Nov) / 2am London (4 Nov) / 9pm New York (3 Nov).

Results should be clear by 10am Singapore (4-Nov) / 2am London (4-Nov) / 9pm New York (3-Nov)

Risk factor: postal vote. The data that we have so far shows that more mail ballots have been requested by Democrats than Republicans in Florida, Pennsylvania, and North Carolina. In Wisconsin the parties are matched, and in Michigan it appears the GOP has an advantage. On first glance this sounds positive for Biden, but it is not clear whether mail ballots represent the participation of new voters who previously did not vote, or merely existing voters changing the way they vote. It is worth noting that there may exist a sampling bias in counting mail-ballots because Trump’s campaign against mail voting might have turned usage of the facility into a partisan issue.

Is a tie possible? Yes. If both candidates get 268 electoral college votes, then it is considered a tie. Two things can happen:

  • Members of the electoral college can “go rogue” (i.e. back a candidate who did not win the plurality in that state), breaking the tie. They can do this even in the absence of a tie.
  • Alternatively, the new House will elect the President when they meet on 6 January 2021. Each state delegation gets one vote (i.e. 50 votes). Since the GOP control 26 state delegations, the Republicans will end up winning the White House in this scenario.

Regardless of how (if) a tie is eventually resolved, this would be a controversial result. The last time such a tie took place was in the 1800s.

Maine and Nebraska: Unlike the other states, Maine and Nebraska allocate electoral college votes based on some degree of proportional representation. I am assuming that Maine will give one electoral college vote to the GOP this year (ME-2) while the rest go to the Democrats, as was the case in 2016. Similarly, I assume Nebraska will give one EC vote to the Democrats (NE-2) and the rest to the GOP.

If you have questions or feedback, feel free to reach out to me: abbas [dot] keshvani [at] gmail.com. All charts created on Python.

Indian Elections 2014 – a Summary

India conducted general elections between 7th April and 12th May , which elected a Member of Parliament to represent each of the 543 constituencies that make up the country.

The opposition BJP won 31% of the votes, which yielded them 282 out of 543 seats in parliament, or 52% of all seats. The BJP allied with smaller parties, such as the Telugu Desam Party, to form the National Democratic Alliance (NDA). Altogether, the NDA won 39% of the votes and 336 seats (62%).

india
India’s parties, topped up by their allies

Turnout was pretty good: 541 million Indians, or 66% of the total vote bank, participated in the polls.

Google and Bing both performed excellent analytics on the election results, but I thought Bing’s was easier to use since their visual is a clean and simple India-only map. They actually out-simpled Google this time.

You are more likely to vote BJP if you speak Hindi
Bing: A constituency is more likely to elect BJP (orange) if its people speak Hindi

Interestingly, the BJP’s victories seem to come largely from Hindi speakers, traditionally concentrated in the north and west parts of India. Plenty of non-Hindi speakers voted for the BJP too, such as in Gujarat and Maharashtra, but votes in south and east of the country generally went to a more diverse pantheon of parties.

Abbas Keshvani